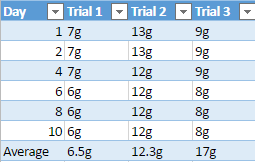
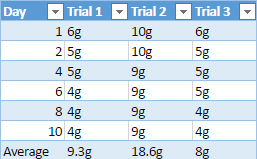
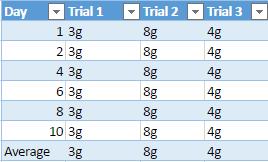
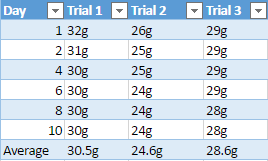
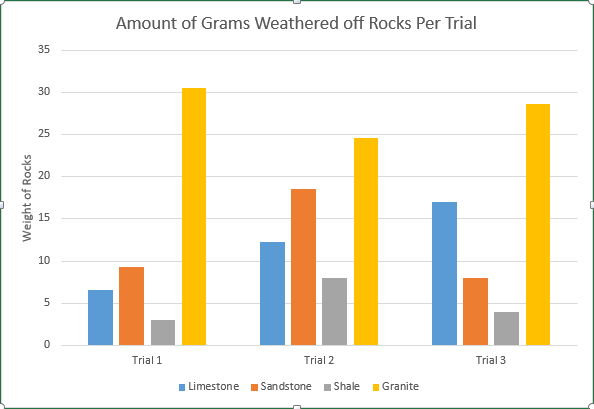
annamalexander in Uncategorized May 30, 2016 68 Words Raw Data/Final Data/Graphs Results of this experiment are shown in these four different tables for each type of rock: Table 1: Limestone Table 2: Sandstone Table 3: Shale Table 4: Granite Graphs of final results through out all three trials Share this:TwitterFacebookLike Loading...